Background
Some time ago, I received feedback that the application memory usage was very high, resulting in frequent restarts, so I was asked to investigate what was going on;
I didn’t pay much attention to this problem before, so I made a record of the process of checking and analyzing this time.
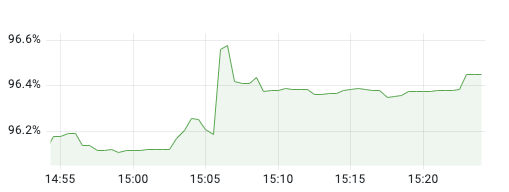
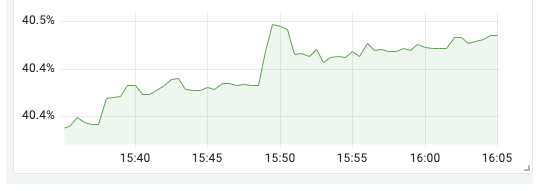
First, I checked the Pod monitoring in the monitoring panel.

It is found that it is indeed almost full, but at this point, when you go to check the JVM occupancy of the application, it is only about 30%; it means that it is not that the application memory is full that causes the OOM of the JVM, but that the Pod’s memory is full, causing the Pod’s memory to overflow and thus be killed by k8s.
And k8s has to restart a Pod in order to maintain the number of copies of the application, so it looks like the application is restarted after running for a while.

The application is configured with JVM 8G, and the memory requested by the container is 16G, so the Pod’s memory footprint looks to be about 50%.
The principle of containers
Before solving this problem, let’s briefly understand the principle of container operation, because all applications in k8s are running in containers, and containers are essentially just an image running on the host.
But when we use Docker, we will feel that each container launched application does not interfere with each other, from the file system, network, CPU, memory, these can be completely isolated, just like two applications running in different servers.
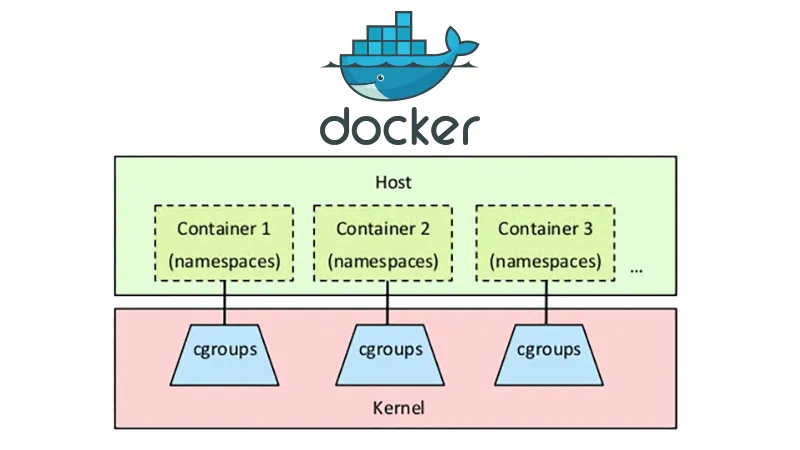
In fact, this is not a hack, Linux already supports namespace isolation as early as version 2.6.x. Using namespace you can isolate two processes completely.
It is not enough to isolate resources, you also need to limit the use of resources, such as CPU, memory, disk, bandwidth, etc.; this can also be configured using cgroups.
It can limit the resources of a process, for example, if the host is a 4-core CPU and 8G memory, in order to protect other containers, you have to configure the usage limit for this container: 1 core CPU and 2G memory.

This diagram clearly illustrates the role of namespace and cgroups in container technology, which simply means that
- namespace is responsible for isolation
- cgroups is responsible for restriction
There is a corresponding representation in k8s.
This manifest indicates that the application needs to allocate at least one 0.1 core and 1024M resources for a container, with a maximum CPU limit of 4 cores.
Different OOMs
Going back to the problem, we can confirm that the container had an OOM which led to a restart by k8s, which is what we configured limits for.
k8s memory overflow causes the container to exit with an event log with exit code 137.
Because the application’s JVM memory configuration and the container’s configuration size are the same, both are 8GB, but the Java application also has some non-JVM managed memory, such as off-heap memory, which can easily lead to the container memory size exceeds the limit of 8G, which also leads to the container memory overflow.
Optimization in cloud-native context
Since this application itself does not use much memory, it is recommended to limit the heap memory to 4GB, which avoids the container memory overrun and thus solves the problem.
Of course, we will also add a recommendation in the application configuration field afterwards: it is recommended that the JVM configuration is less than 2/3 of the container limit to set aside some memory.
The traditional Java application development model does not even understand the container memory size, because everyone’s application was deployed on a virtual machine with large memory, so the container memory limit was not perceived.
This may be especially obvious in Java applications, after all, there is an extra JVM; even in older versions of the JDK, if the heap memory size is not set, the memory limit of the container cannot be sensed, and thus the automatically generated Xmx is larger than the memory size of the container, resulting in OOM.