When the website is online, the increase of traffic or temporary function failure will cause the user experience is quite bad, and how to find the bottleneck of performance quickly? Usually when the CPU is rushed to 100%, it is sometimes quite difficult to replicate and find out the key problem points. This article will introduce a set of tools called pyroscope, which allows developers to quickly find the code of performance bottlenecks.

pyroscope currently supports the Python, Ruby or Go environments. The author will introduce the Go environment below.
What is Pyroscope?
Pyroscope is an open source performance monitoring platform with a simple Server and Agent architecture that allows developers to easily monitor code performance. Whether you are looking for performance data within 10 seconds or minutes, you can quickly and instantly see it. The storage behind Pyroscope uses Badger, a Key-Value database, and the performance is very good. Currently, only 3 languages are supported (Python, Ruby and Go) and NodeJS is expected to be supported in the future. If you have not yet imported any performance analysis tool or platform, Pyroscope is your best choice.
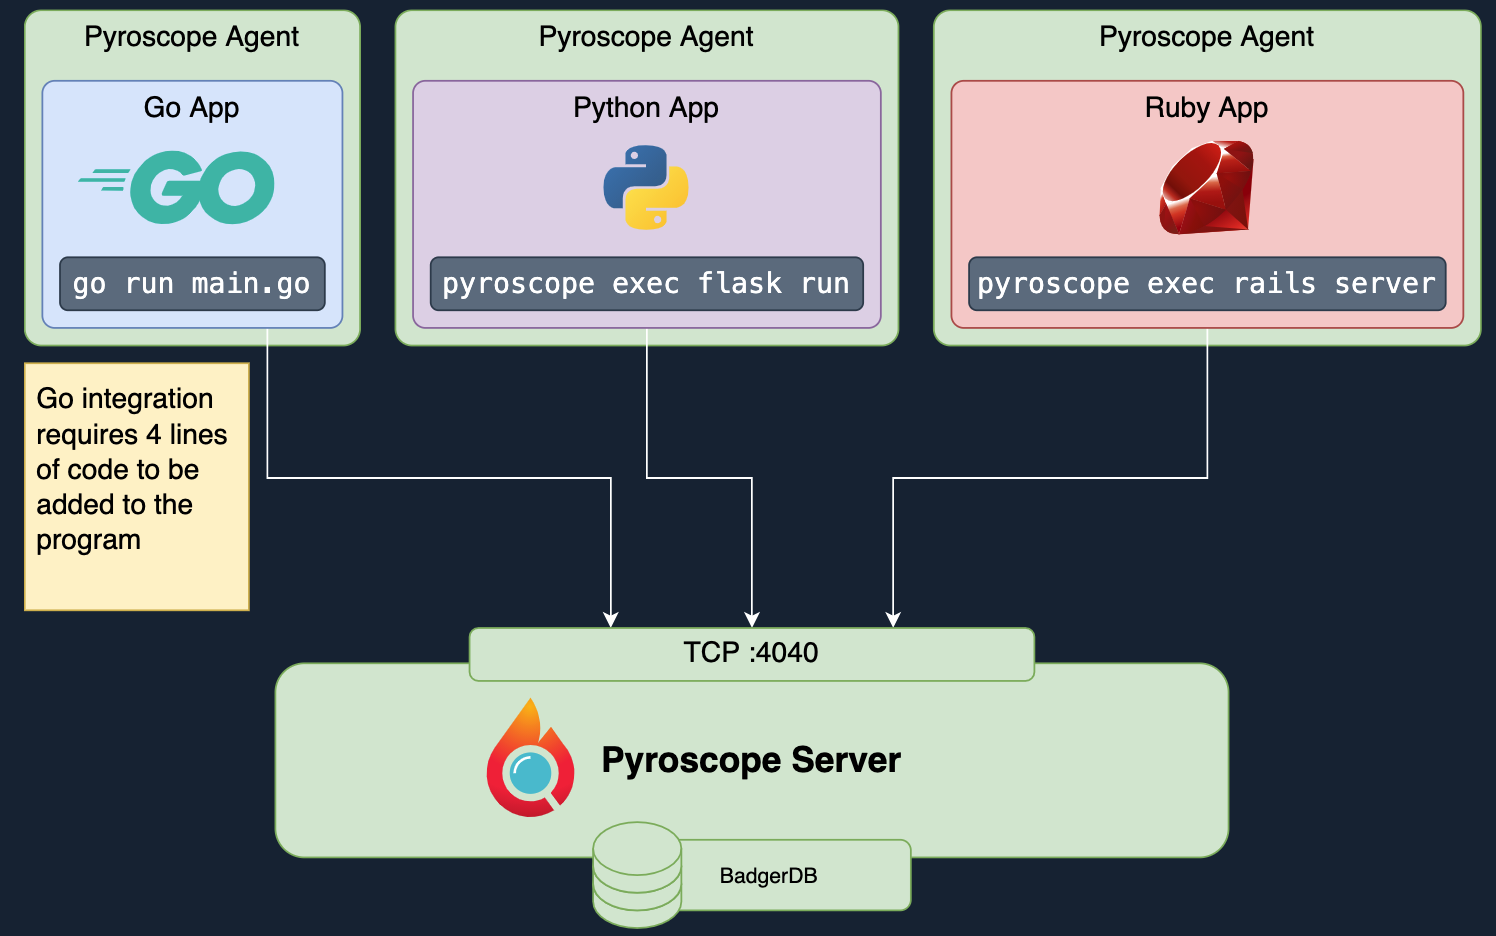
Pyroscope Architecture
If you are looking for a performance analysis tool platform, Pyroscope offers three major advantages that developers can use with confidence
- low CPU usage, no impact on existing platforms
- the ability to store years of data and look at it at a granularity as small as 10 seconds
- compressed data storage, reducing wasted hard disk space
The architecture is only divided into Server and Agent, you can refer to the following architecture diagram. In addition to the Go language, Python and Ruby App both use the pyroscope command to start the relevant app to monitor the system performance. The following architecture diagram from the official website

Start Pyroscope service
There are two ways to start Pyroscope, the first is to start it directly with the docker command
|
|
Another option is to use docker-compose to start
Installing agent in Go
This article uses the Go language as an example, first import package
|
|
Then just write the following code in main.go:
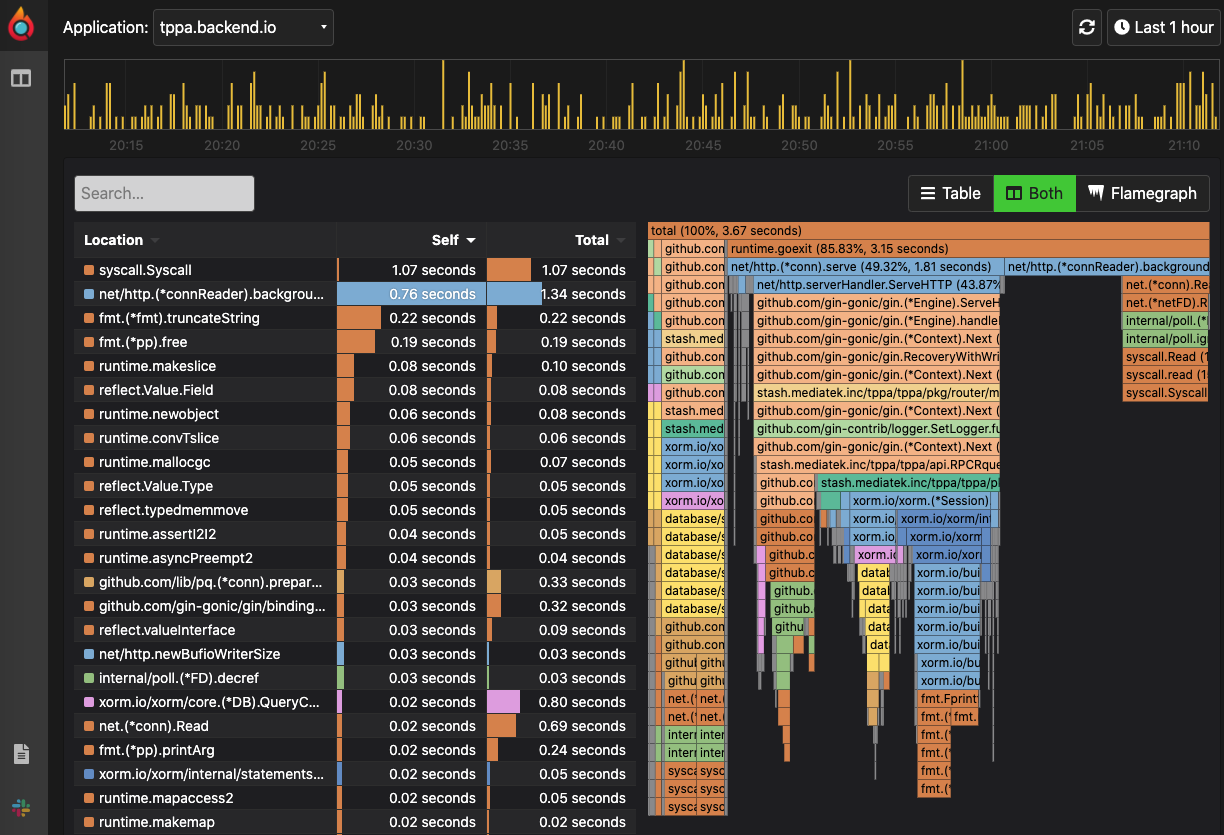
You can replace http://pyroscope with a custom hostname, and then open the above URL to see the performance monitoring screen.

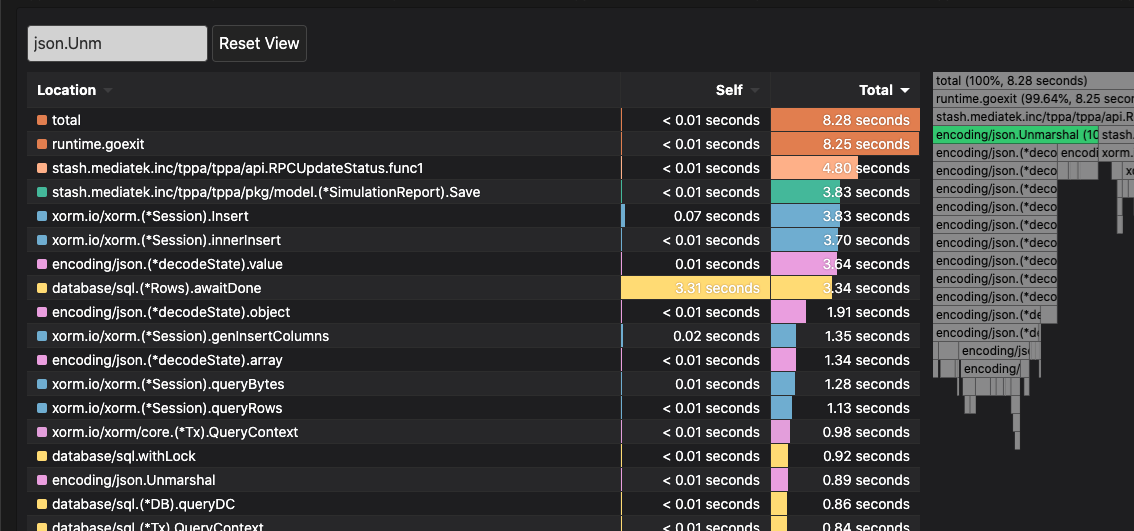
The screen allows you to quickly find out which SQL or function is taking too long to execute.

Summary
This set of tools is very convenient, in Go language although you can use pprof to quickly find the problem, but inevitably still need to manually some places to find out the performance bottleneck, with this set of platform, you can monitor all the App, when the user has any problems, you can quickly check through Pyroscope to see which side of the code has problems.