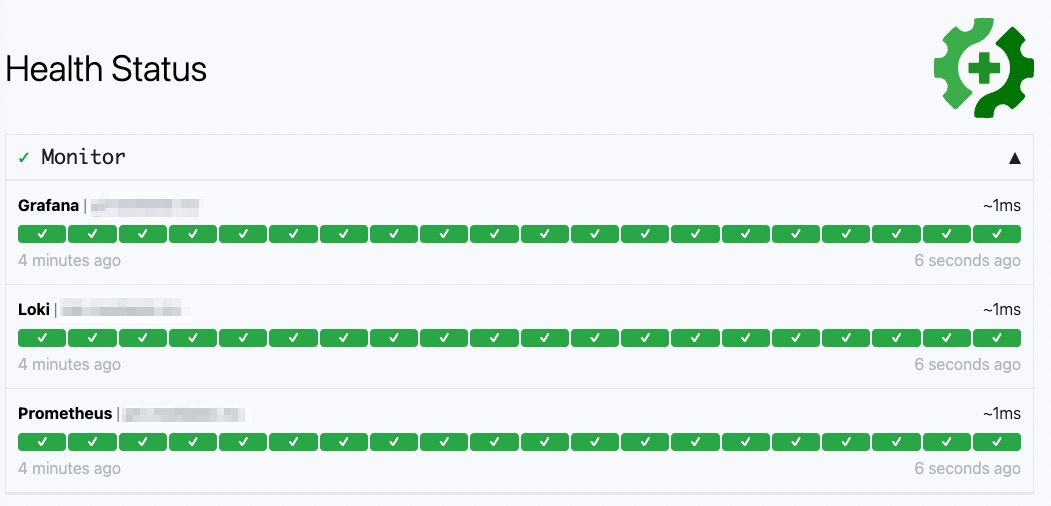
After deploying a service, it’s important to make it clear to the team that the service is running. For example, GitHub provides a overall running page that monitors the status of common operations such as Git Operations, Webhooks, or GitHub Actions and other services. This allows developers to check the status of their services in real time when they encounter problems and take appropriate action. There are many online services like this, such as Atlassian’s Statuspage or PingPong, and more free services can be found directly at See awesome-status-pages for more free services. This article introduces a set of open source software Gatus, which is written in Go language and is very lightweight.
What is Gatus
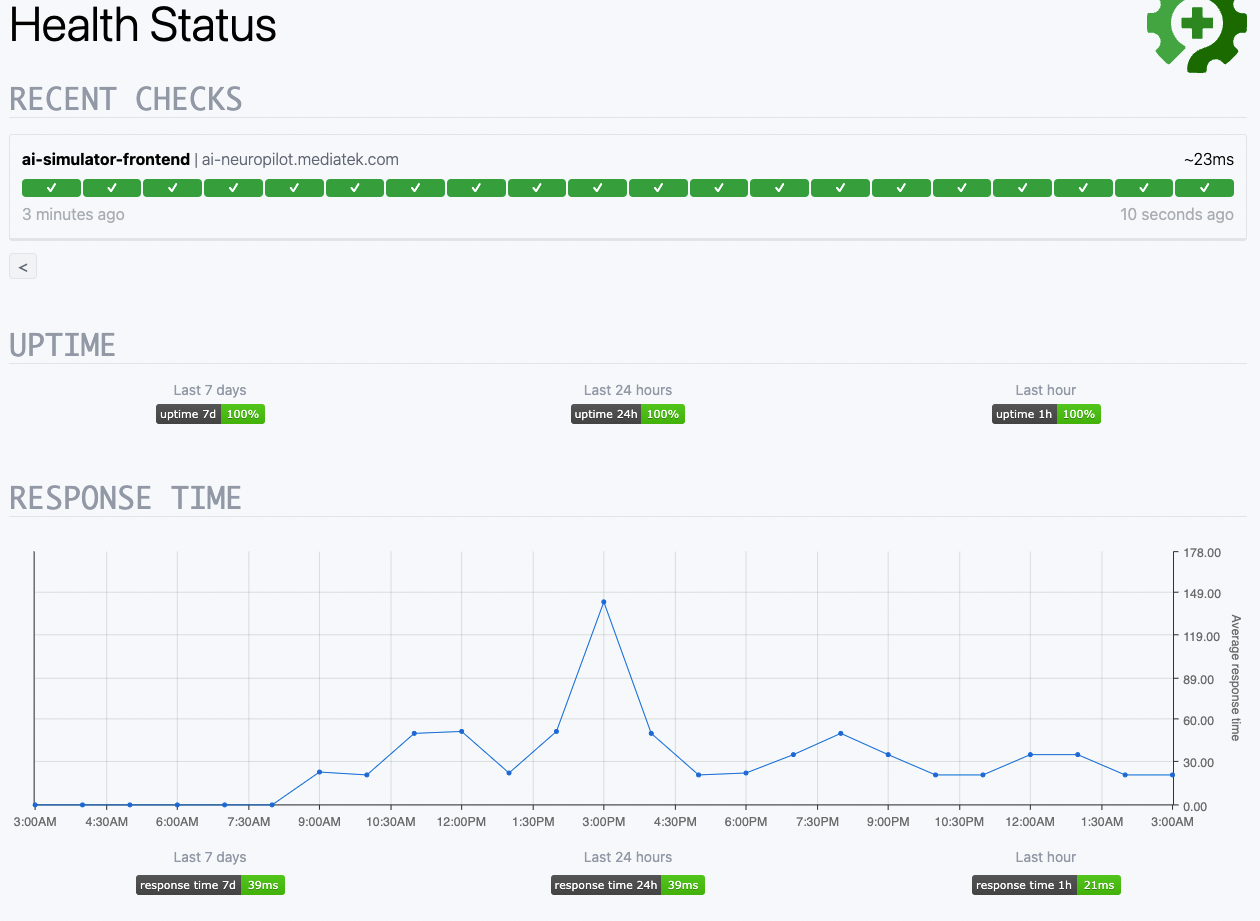
Gatus provides a lightweight service health monitoring webpage for developers to monitor service status through simple HTTP, ICMP, TCP protocols, etc., and determine the health of a website based on the Status Code or Response time and Body content of the webpage response, and set different Alerts if an abnormality occurs. If an abnormality occurs, you can set different alerts such as Slack, Email, Teams, Discord or Telegram, and other common real-time software. You can see the actual status of the Dashboard at check this link.
Why choose Gatus
The official has actually written very clearly
Why would I use Gatus when I can just use Prometheus, Alertmanager, Cloudwatch or even Splunk?
The first point you developers can think about is how to monitor the status of the entire service, instead of waiting until the customer encounters a problem before you know what’s going on. Gatus can configure and check each function from the customer’s point of view, and the team can monitor the important services or interfaces and organize the data in real time, so that the team can know the status earlier than the customer.
The second point the team can consider is that if they start with Prometheus, is the threshold too high and does the team really have the time and manpower to do complete monitoring? Using Prometheus + Alert to the Grafana monitoring page takes a lot of time and manpower to complete, and are these really the indicators that the customer wants to see? And are these indicators really what the customer wants to see? And are the alerts being received correctly? Gatus allows the team to quickly monitor the entire service with a simple setup, and real-time notifications can be set up in a matter of hours.
Docker Installation
The fastest way to install is via Docker, with Postgres, but you can also use SQLite lightweight database.
|
|
As you can see, you also need to create a config directory with a new config.yaml file.
Once started, open the browser http://localhost:8085 to see the live page.
Gatus Settings File
Since our team has many projects, each project designs the website structure and services, so we can use group settings to distinguish different project settings.
|
|
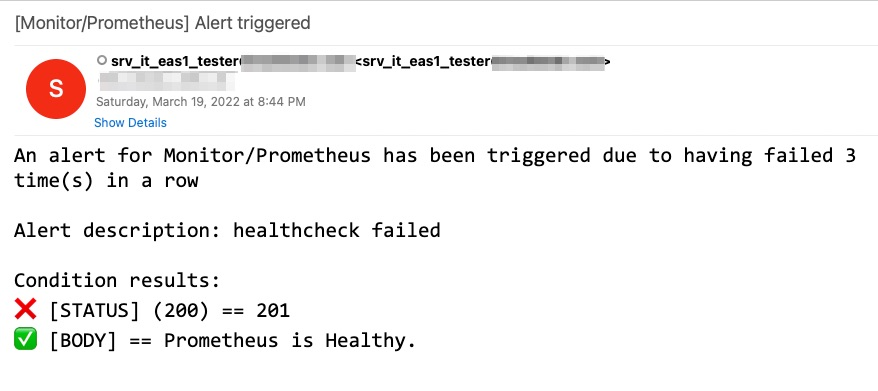
As you can see above, we can monitor the health of Prometheus, not only set STATUS, but also set BODY, which is quite simple. In addition, Alerts can be set in various ways, such as Email, Discord, Slack, etc… Take Email as an example
Look at the Email notification message and you can clearly see the status of all condition detection.

Since there are always new services or tests, you need to move to the config file often, and Gatus provides real-time detection of file configuration changes to dynamically adjust the web monitoring display. This point needs to be noted in the docker-compose not to hang the config.yaml directly inside the container. I have issued a PR fix example, after the change, you can put the config file into the service via CI/CD in real time. Next, let’s see how to deploy through Drone, two steps to finish.
|
|
The directory structure is as follows, after which each team member can adjust their own settings.
Gatus notification function is not enough
If you have used it, you can know that all Alert notifications can only set a group of data, like Email, you can only set a group of To list, and can not adjust the To list according to different groups, this in last year the author also issued Issue to record this point issues/96), I also issued PR to supplement the Email function according to this point of record, if PR is accepted, then the next version can use the function under.
Summary
The reason I choose this set is simple setup and easy deployment, in addition to monitoring web services, the test team can actually take this set, to write a large number of tests to monitor all services and performance, this alone can save a lot of time for the team to do testing. In addition, each service can also see the response time results.
