Fasthttp vs Nethttp

1. Background

After writing the classic “hello, world” program, Go beginners may be eager to experience Go’s powerful standard library, for example, writing a fully functional web server like the following example in a few lines of code.

 1
 2
 3
 4
 5
 6
 7
 8
 9
10
11
12
13
14
15
16
// 来自https://tip.golang.org/pkg/net/http/#example_ListenAndServe
package main

import (
    "io"
    "log"
    "net/http"
)

func main() {
    helloHandler := func(w http.ResponseWriter, req *http.Request) {
        io.WriteString(w, "Hello, world!\n")
    }
    http.HandleFunc("/hello", helloHandler)
    log.Fatal(http.ListenAndServe(":8080", nil))
}

The go net/http package is a more balanced generic implementation that meets the needs of most gopher 90%+ scenarios and has the following advantages.

  • standard library packages, without the need to introduce any third-party dependencies.
  • Better satisfaction with the http specification.
  • relatively high performance without having to do any optimization.
  • Support for HTTP proxies.
  • Support for HTTPS.
  • Seamless support for HTTP/2.

However, because of the “balanced” generic implementation of the http package, net/http may not be able to perform well in some performance-critical areas, and there is not much room for tuning. This is when we turn our attention to other third-party http server framework implementations.

And in the third-party http server framework, a framework called fasthttp is mentioned and adopted more. fasthttp official website claims that its performance is ten times that of net/http (based on the results of the go test benchmark).

fasthttp uses many best practices on performance optimization, especially on memory object reuse, using sync.Pool extensively to reduce the pressure on Go GC.

So in a real environment, how much faster can fasthttp be than net/http? It so happens that there are two servers available with decent performance, and in this article we will look at their actual performance in this real world environment.

2. performance tests

We implement two almost “zero business” programs under test using net/http and fasthttp respectively.

  • nethttp:
 1
 2
 3
 4
 5
 6
 7
 8
 9
10
11
12
13
14
15
16
17
18
19
20
21
22
23
24
25
26
// github.com/bigwhite/experiments/blob/master/http-benchmark/nethttp/main.go
package main

import (
    _ "expvar"
    "log"
    "net/http"
    _ "net/http/pprof"
    "runtime"
    "time"
)

func main() {
    go func() {
        for {
            log.Println("当前routine数量:", runtime.NumGoroutine())
            time.Sleep(time.Second)
        }
    }()

    http.Handle("/", http.HandlerFunc(func(w http.ResponseWriter, r *http.Request) {
        w.Write([]byte("Hello, Go!"))
    }))

    log.Fatal(http.ListenAndServe(":8080", nil))
}
  • fasthttp:
 1
 2
 3
 4
 5
 6
 7
 8
 9
10
11
12
13
14
15
16
17
18
19
20
21
22
23
24
25
26
27
28
29
30
31
32
33
34
35
36
37
38
39
40
41
42
// github.com/bigwhite/experiments/blob/master/http-benchmark/fasthttp/main.go

package main

import (
    "fmt"
    "log"
    "net/http"
    "runtime"
    "time"

    _ "expvar"

    _ "net/http/pprof"

    "github.com/valyala/fasthttp"
)

type HelloGoHandler struct {
}

func fastHTTPHandler(ctx *fasthttp.RequestCtx) {
    fmt.Fprintln(ctx, "Hello, Go!")
}

func main() {
    go func() {
        http.ListenAndServe(":6060", nil)
    }()

    go func() {
        for {
            log.Println("当前routine数量:", runtime.NumGoroutine())
            time.Sleep(time.Second)
        }
    }()

    s := &fasthttp.Server{
        Handler: fastHTTPHandler,
    }
    s.ListenAndServe(":8081")
}

The client side of the stress test for the target under test is based on hey, an http stress test tool. To facilitate the adjustment of the stress level, we “wrap” hey in the following shell script (only It is suitable for running on linux only).

 1
 2
 3
 4
 5
 6
 7
 8
 9
10
11
12
13
14
15
16
17
18
19
20
21
22
23
24
25
26
27
// github.com/bigwhite/experiments/blob/master/http-benchmark/client/http_client_load.sh

# ./http_client_load.sh 3 10000 10 GET http://10.10.195.181:8080
echo "$0 task_num count_per_hey conn_per_hey method url"
task_num=$1
count_per_hey=$2
conn_per_hey=$3
method=$4
url=$5

start=$(date +%s%N)
for((i=1; i<=$task_num; i++)); do {
    tm=$(date +%T.%N)
        echo "$tm: task $i start"
    hey -n $count_per_hey -c $conn_per_hey -m $method $url > hey_$i.log
    tm=$(date +%T.%N)
        echo "$tm: task $i done"
} & done
wait
end=$(date +%s%N)

count=$(( $task_num * $count_per_hey ))
runtime_ns=$(( $end - $start ))
runtime=`echo "scale=2; $runtime_ns / 1000000000" | bc`
echo "runtime: "$runtime
speed=`echo "scale=2; $count / $runtime" | bc`
echo "speed: "$speed

An example execution of the script is as follows.

 1
 2
 3
 4
 5
 6
 7
 8
 9
10
11
12
13
14
15
16
17
18
19
20
bash http_client_load.sh 8 1000000 200 GET http://10.10.195.134:8080
http_client_load.sh task_num count_per_hey conn_per_hey method url
16:58:09.146948690: task 1 start
16:58:09.147235080: task 2 start
16:58:09.147290430: task 3 start
16:58:09.147740230: task 4 start
16:58:09.147896010: task 5 start
16:58:09.148314900: task 6 start
16:58:09.148446030: task 7 start
16:58:09.148930840: task 8 start
16:58:45.001080740: task 3 done
16:58:45.241903500: task 8 done
16:58:45.261501940: task 1 done
16:58:50.032383770: task 4 done
16:58:50.985076450: task 7 done
16:58:51.269099430: task 5 done
16:58:52.008164010: task 6 done
16:58:52.166402430: task 2 done
runtime: 43.02
speed: 185960.01

From the incoming parameters, the script starts 8 tasks in parallel (one task starts one hey), each task establishes 200 concurrent connections to http://10.10.195.134:8080 and sends 100w http GET requests.

We use two servers to host the target application under test and the stress tool script.

  • Server where the target application is located: 10.10.195.181 (physical machine, Intel x86-64 CPU, 40 cores, 128G RAM, CentOs 7.6)
 1
 2
 3
 4
 5
 6
 7
 8
 9
10
11
12
13
14
15
16
17
18
19
20
21
22
23
24
25
26
27
28
29
30
$ cat /etc/redhat-release
CentOS Linux release 7.6.1810 (Core) 

$ lscpu
Architecture:          x86_64
CPU op-mode(s):        32-bit, 64-bit
Byte Order:            Little Endian
CPU(s):                40
On-line CPU(s) list:   0-39
Thread(s) per core:    2
Core(s) per socket:    10
座:                 2
NUMA 节点:         2
厂商 ID:           GenuineIntel
CPU 系列:          6
型号:              85
型号名称:        Intel(R) Xeon(R) Silver 4114 CPU @ 2.20GHz
步进:              4
CPU MHz:             800.000
CPU max MHz:           2201.0000
CPU min MHz:           800.0000
BogoMIPS:            4400.00
虚拟化:           VT-x
L1d 缓存:          32K
L1i 缓存:          32K
L2 缓存:           1024K
L3 缓存:           14080K
NUMA 节点0 CPU:    0-9,20-29
NUMA 节点1 CPU:    10-19,30-39
Flags:                 fpu vme de pse tsc msr pae mce cx8 apic sep mtrr pge mca cmov pat pse36 clflush dts acpi mmx fxsr sse sse2 ss ht tm pbe syscall nx pdpe1gb rdtscp lm constant_tsc art arch_perfmon pebs bts rep_good nopl xtopology nonstop_tsc aperfmperf eagerfpu pni pclmulqdq dtes64 ds_cpl vmx smx est tm2 ssse3 sdbg fma cx16 xtpr pdcm pcid dca sse4_1 sse4_2 x2apic movbe popcnt tsc_deadline_timer aes xsave avx f16c rdrand lahf_lm abm 3dnowprefetch epb cat_l3 cdp_l3 intel_pt ssbd mba ibrs ibpb stibp tpr_shadow vnmi flexpriority ept vpid fsgsbase tsc_adjust bmi1 hle avx2 smep bmi2 erms invpcid rtm cqm mpx rdt_a avx512f avx512dq rdseed adx smap clflushopt clwb avx512cd avx512bw avx512vl xsaveopt xsavec xgetbv1 cqm_llc cqm_occup_llc cqm_mbm_total cqm_mbm_local dtherm ida arat pln pts pku ospke spec_ctrl intel_stibp flush_l1d
  • Server where the stress tool is located: 10.10.195.133 (physical machine, Kunpeng arm64 cpu, 96 cores, 80G RAM, CentOs 7.9)
 1
 2
 3
 4
 5
 6
 7
 8
 9
10
11
12
13
14
15
16
17
18
19
20
21
22
23
24
25
# cat /etc/redhat-release
CentOS Linux release 7.9.2009 (AltArch)

# lscpu
Architecture:          aarch64
Byte Order:            Little Endian
CPU(s):                96
On-line CPU(s) list:   0-95
Thread(s) per core:    1
Core(s) per socket:    48
座:                 2
NUMA 节点:         4
型号:              0
CPU max MHz:           2600.0000
CPU min MHz:           200.0000
BogoMIPS:            200.00
L1d 缓存:          64K
L1i 缓存:          64K
L2 缓存:           512K
L3 缓存:           49152K
NUMA 节点0 CPU:    0-23
NUMA 节点1 CPU:    24-47
NUMA 节点2 CPU:    48-71
NUMA 节点3 CPU:    72-95
Flags:                 fp asimd evtstrm aes pmull sha1 sha2 crc32 atomics fphp asimdhp cpuid asimdrdm jscvt fcma dcpop asimddp asimdfhm

I use dstat to monitor the resource usage of the host where the target under test is located (dstat -tcdngym), especially the cpu load; monitor memstats through expvarmon, as there is no business, the memory usage is very little; check the ranking of the consumption of various resources in the target program through go tool pprof.

Here is a table of data created after several tests.

test data

3. Brief analysis of the results

The above test results are limited by the specific scenario, the accuracy of the test tool and script, and the stress test environment, but they truly reflect the performance trend of the target under test. We see that fasthttp does not outperform net http by a factor of 10 when given the same pressure, and even in such a specific scenario, twice the performance of net/http is not achieved: we see that in several use cases where the target host cpu resource consumption is close to 70%, fasthttp’s performance is only 30% to 70% higher than that of net/http. ~70% or so.

So why did fasthttp’s performance fall short of expectations? To answer this question, it is necessary to look at the respective implementation principles of net/http and fasthttp! Let’s take a look at the working principle of net/http schematic.
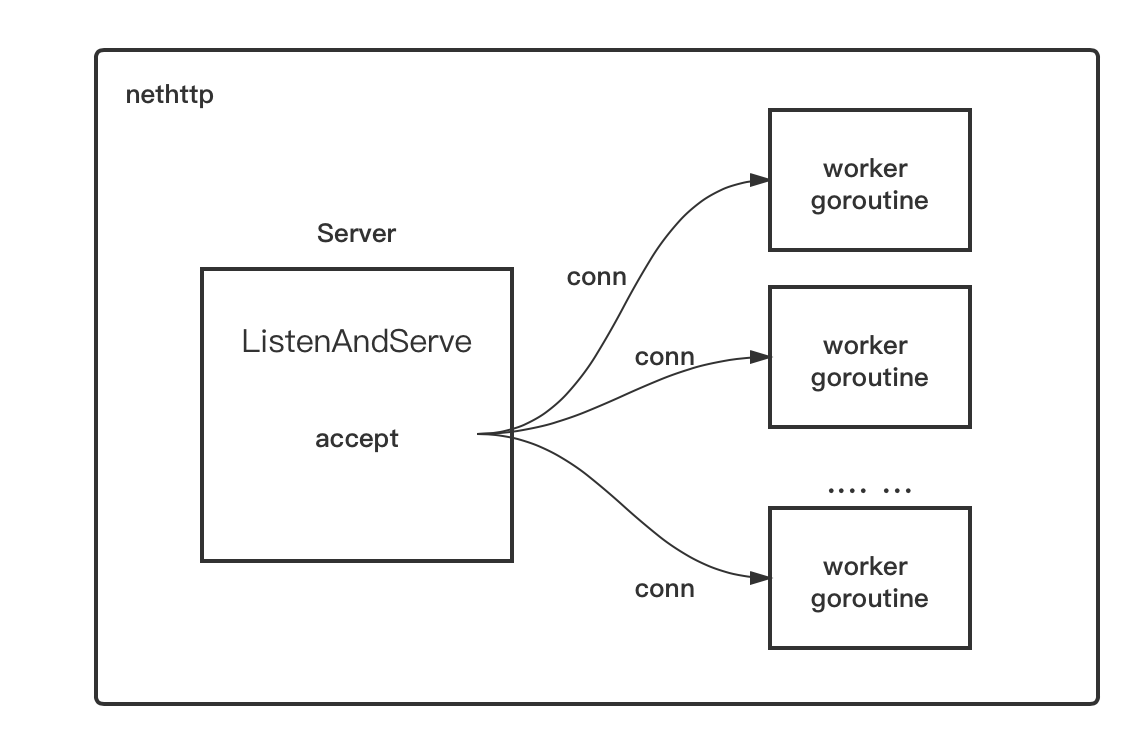
neth/http working principle

The principle of http package as a server side is very simple, that is, after accepting a connection (conn), the conn will be assigned to a worker goroutine to handle, the latter continues to exist until the end of the conn’s life cycle: that is, the connection is closed.

Here is a diagram of how fasthttp works.
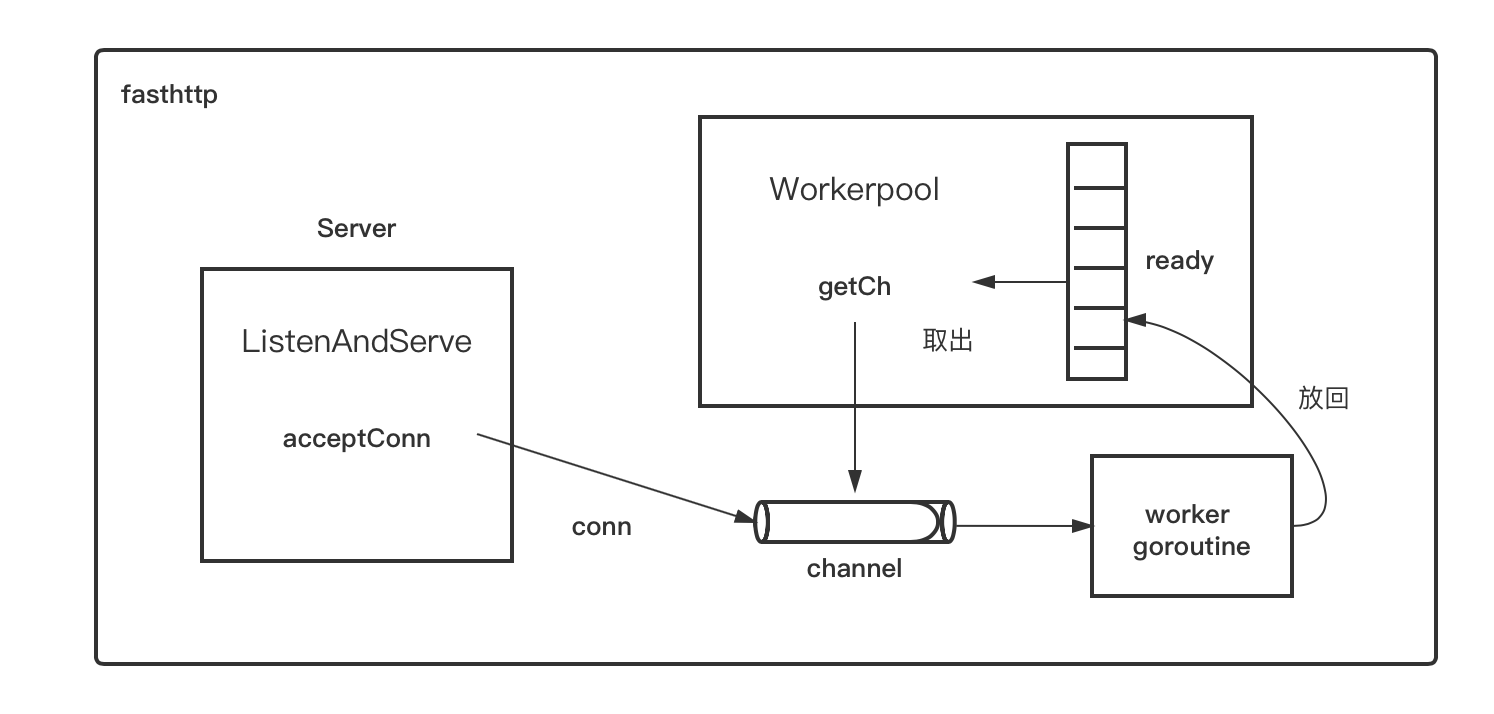
fasthttp working principle

fasthttp has designed a mechanism to reuse goroutines as much as possible instead of creating a new one each time. fasthttp’s Server accepts a conn and tries to take a channel from the ready slices in the workerpool, which corresponds to the The channel corresponds to a worker goroutine. Once the channel is removed, the accepted conn is written to the channel, and the worker goroutine at the other end of the channel handles the reading and writing of the data on the conn. After processing the conn, the worker goroutine will not exit, but will put its corresponding channel back into the ready slice in the workerpool and wait for it to be taken out next time.

fasthttp’s goroutine reuse strategy is initially very good, but in the test scenario here the effect is not obvious, as can be seen from the test results, in the same client concurrency and pressure, the number of goroutines used by net/http and fasthttp is not much different. This is caused by the test model: in our test, each task in the hey will launch a fixed number of long connections (keep-alive) to the target under test, and then launch a “saturation” request on each connection. This fasthttp workerpool goroutine once received a certain conn can only be put back after the end of the communication on the conn, and the conn will not be closed until the end of the test, so such a scenario is equivalent to let fasthttp “degraded Therefore, such a scenario is equivalent to making fasthttp “degenerate” into a net/http model, and also tainted with the “defects” of net/http: once the number of goroutines is more, the consumption brought by the go runtime itself scheduling is not negligible and even exceeds the proportion of resources consumed by business processing. Here are the results of fasthttp’s cpu profile for 200 long connections, 8000 long connections and 16000 long connections respectively.

 1
 2
 3
 4
 5
 6
 7
 8
 9
10
11
12
13
14
15
16
17
18
19
20
21
22
23
24
25
26
27
28
29
30
31
32
33
34
35
36
37
38
39
40
41
42
43
44
45
46
47
48
49
50
51
52
53
54
55
200长连接:

(pprof) top -cum
Showing nodes accounting for 88.17s, 55.35% of 159.30s total
Dropped 150 nodes (cum <= 0.80s)
Showing top 10 nodes out of 60
      flat  flat%   sum%        cum   cum%
     0.46s  0.29%  0.29%    101.46s 63.69%  github.com/valyala/fasthttp.(*Server).serveConn
         0     0%  0.29%    101.46s 63.69%  github.com/valyala/fasthttp.(*workerPool).getCh.func1
         0     0%  0.29%    101.46s 63.69%  github.com/valyala/fasthttp.(*workerPool).workerFunc
     0.04s 0.025%  0.31%     89.46s 56.16%  internal/poll.ignoringEINTRIO (inline)
    87.38s 54.85% 55.17%     89.27s 56.04%  syscall.Syscall
     0.12s 0.075% 55.24%     60.39s 37.91%  bufio.(*Writer).Flush
         0     0% 55.24%     60.22s 37.80%  net.(*conn).Write
     0.08s  0.05% 55.29%     60.21s 37.80%  net.(*netFD).Write
     0.09s 0.056% 55.35%     60.12s 37.74%  internal/poll.(*FD).Write
         0     0% 55.35%     59.86s 37.58%  syscall.Write (inline)
(pprof) 

8000长连接:

(pprof) top -cum
Showing nodes accounting for 108.51s, 54.46% of 199.23s total
Dropped 204 nodes (cum <= 1s)
Showing top 10 nodes out of 66
      flat  flat%   sum%        cum   cum%
         0     0%     0%    119.11s 59.79%  github.com/valyala/fasthttp.(*workerPool).getCh.func1
         0     0%     0%    119.11s 59.79%  github.com/valyala/fasthttp.(*workerPool).workerFunc
     0.69s  0.35%  0.35%    119.05s 59.76%  github.com/valyala/fasthttp.(*Server).serveConn
     0.04s  0.02%  0.37%    104.22s 52.31%  internal/poll.ignoringEINTRIO (inline)
   101.58s 50.99% 51.35%    103.95s 52.18%  syscall.Syscall
     0.10s  0.05% 51.40%     79.95s 40.13%  runtime.mcall
     0.06s  0.03% 51.43%     79.85s 40.08%  runtime.park_m
     0.23s  0.12% 51.55%     79.30s 39.80%  runtime.schedule
     5.67s  2.85% 54.39%     77.47s 38.88%  runtime.findrunnable
     0.14s  0.07% 54.46%     68.96s 34.61%  bufio.(*Writer).Flush

16000长连接:

(pprof) top -cum
Showing nodes accounting for 239.60s, 87.07% of 275.17s total
Dropped 190 nodes (cum <= 1.38s)
Showing top 10 nodes out of 46
      flat  flat%   sum%        cum   cum%
     0.04s 0.015% 0.015%    153.38s 55.74%  runtime.mcall
     0.01s 0.0036% 0.018%    153.34s 55.73%  runtime.park_m
     0.12s 0.044% 0.062%       153s 55.60%  runtime.schedule
     0.66s  0.24%   0.3%    152.66s 55.48%  runtime.findrunnable
     0.15s 0.055%  0.36%    127.53s 46.35%  runtime.netpoll
   127.04s 46.17% 46.52%    127.04s 46.17%  runtime.epollwait
         0     0% 46.52%       121s 43.97%  github.com/valyala/fasthttp.(*workerPool).getCh.func1
         0     0% 46.52%       121s 43.97%  github.com/valyala/fasthttp.(*workerPool).workerFunc
     0.41s  0.15% 46.67%    120.18s 43.67%  github.com/valyala/fasthttp.(*Server).serveConn
   111.17s 40.40% 87.07%    111.99s 40.70%  syscall.Syscall
(pprof)

By comparing the above profiles, we find that when the number of long connections increases (i.e., when the number of goroutines in the workerpool increases), the percentage of go runtime scheduling gradually increases, and at 16000 connections, the various functions of runtime scheduling already rank in the top 4.

4. Optimization method

From the above test results, we can see that fasthttp’s model is less suitable for this kind of connection and continuous “saturation” request scenario, and more suitable for short or long connections but no continuous saturation request, in the latter scenario, its goroutine reuse model can be better played.

But even if “degraded” to the net/http model, fasthttp’s performance is still slightly better than net/http, which is why? These performance improvements are mainly the result of fasthttp in the memory allocation level optimization trick, such as the extensive use of sync.

So, in the scenario of continuous “saturation” requests, how to make the number of goroutines in the fasthttp workerpool does not grow linearly due to the increase in conn? fasthttp official answer is not given, but a path to consider is the use of os multiplexing ( The implementation on linux is epoll), i.e. the mechanism used by go runtime netpoll. With the multiplexing mechanism, this allows each goroutine in the workerpool to handle multiple connections at the same time, so that we can choose the size of the workerpool pool based on the size of the business, instead of growing the number of goroutines almost arbitrarily, as is currently the case. Of course, the introduction of epoll at the user level may also bring about problems such as an increase in the percentage of system calls and an increase in response latency. As for whether the path is feasible, it still depends on the specific implementation and test results.

Note: The Concurrency in fasthttp.Server can be used to limit the number of concurrent goroutines in the workerpool, but since each goroutine only handles one connection, when the Concurrency is set too small, subsequent connections may be denied service by fasthttp. Therefore, the default Concurrency of fasthttp is as follows.

1
const DefaultConcurrency = 256 * 1024

The source code covered in this article can be found here for download.