Introduction
Trickster is comcast’s open source HTTP reverse proxy cache that speeds up TSDB (time series databases, such as Prometheus) queries.
Purpose
Use Trickster to proxy Prometheus in a k8s cluster to verify that Trickster can speed up Grafana queries.
Note: Prometheus and Grafana are already deployed in the cluster
Installation
According to the official documentation, Trickster provides the following installation methods.
- Docker
- k8s
- Helm
- Source code installation
For this installation via Helm, see here for the installation steps.
Install via Helm
Add the Trickster Helm repo.
|
|
To see if it was added successfully.
Here, you need to look at the configuration information of Trickster, namely values.yaml
In order to get Trickster up and running, the following configuration items need to be noted in this configuration file values.yaml.
origins
In the originURL, fill in the existing Prometheus address, i.e. Trickster will proxy this address and cache the query data
caches
Trickster supports a variety of cache types, such as: memory, bbolt, badger, filesystem and redis, which uses memory cache is the default way, based on sync.Map, here we will directly use the default It is recommended to use filesystem and redis for production environment.
replicaCount
The number of pods, the default is 1, here is also the direct use of the default value
service
That is, the way k8s services are exposed, here using the lb way to expose services, you need to configure the annotations inside: service.
Note: AliCloud k8s cluster is used
and change the type inside the service to: LoadBalancer.
ingress
If the above service exposure method is not LoadBalancer, and you want to expose the service through ingress, you can modify the ingress configuration item
resources
The limits and requests configuration for resources, filled in here, is
Installation by command.
|
|
Install trickster using a custom values.yaml, installed under the monitoring namespace, with the installation process in debug mode, which outputs a detailed installation process.
To check if the installation was successful, you can directly visit the http://lb-IP:8480/trickster/ping address and perform a health check.
In addition, you can directly visit: http://lb-IP:8480/metrics to view Trickster’s metrics data
Note: Here the service is exposed via lb, lb-IP is the IP address of lb, 8480 is the default proxy port of Trickster
Verification
Now let’s see if the same queries in Grafana are sped up after using Trickster, and by how much.
First, add a new data source to the existing Grafana with the Trickster reverse proxy URL: http://lb-IP:8480
Find a more time-consuming query panel, do two experiments, each experiment has two groups, the data source are the native Prometheus and Trickster to Prometheus made a proxy, each group experiments refresh panel 15 times, through Grafana’s Query Inspector to see each refresh query time, the results are as follows.
Experiment 1
Check the data of this panel for the past 1 hour, refresh time is 10s, result.
Native Prometheus query time total: 42s, average query time: 2.8s Trickster query time total: 13.899s, the average query time: 0.9266s
Experiment 2
View the data of this panel for the past 3 hours, refresh time is 10s, the result.
Native Prometheus query time total: 108s, average query time: 7.2s Trickster query time total: 22.579s, the average query time: 1.505s
Conclusion
Preliminary verification that Trickster can speed up the queries of temporal databases such as Prometheus.
Principle
So why does Trickster speed up Prometheus queries?
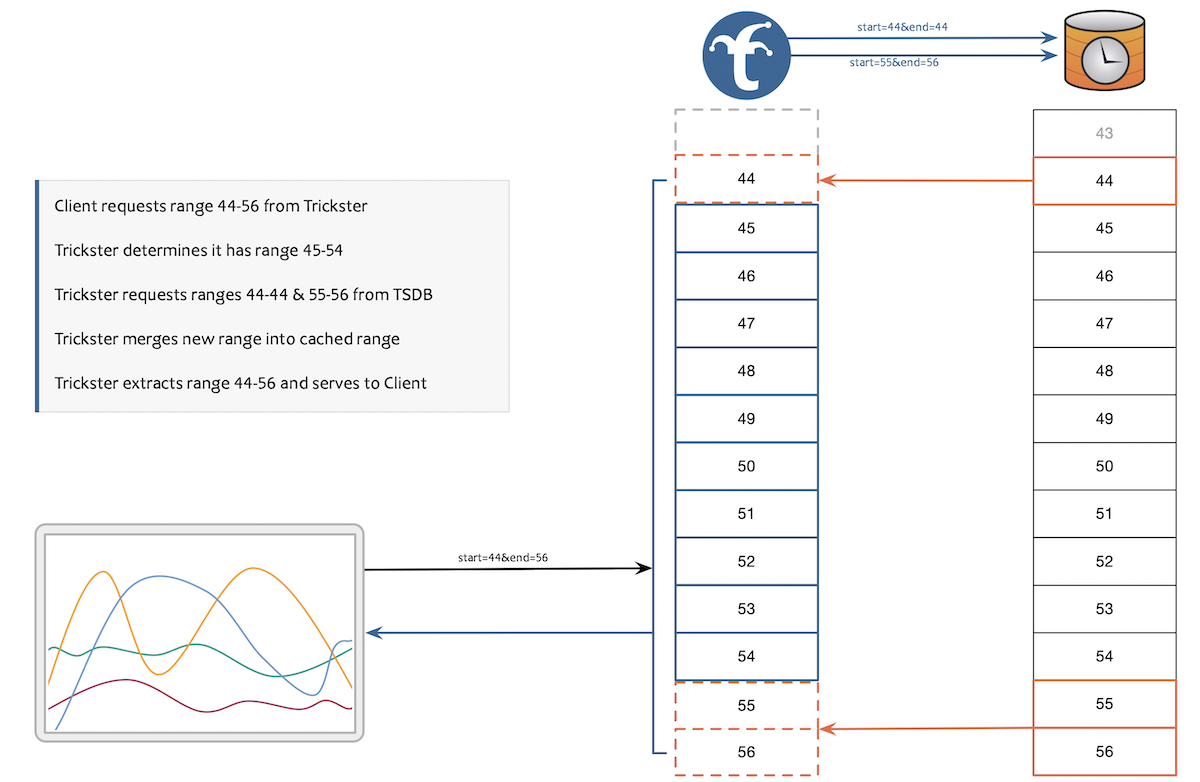
Because every time a dashboard is loaded or reloaded, most dashboards request the entire time range of data from the time series database, while Trickster’s Delta Proxy checks the time range of the client query to determine which data points have been cached and requests only the data points that are really needed on Prometheus, an incremental query that will significantly speed up the chart load time.

Caution
- The above procedure is only for testing the use of Trickster, for reference