Application crashes in Electron
If the exception is only caused by Javascript, you can listen for the relevant Error type event in the application logic and handle it. By listening for crashed related events, you can listen for and respond to application crashes within the application.
The above code can only listen to and handle crashed events, but it can’t tell what caused the crash; to analyze the details, you need to get the minidump file where the crash occurred and debug it.
Application crash files in Electron
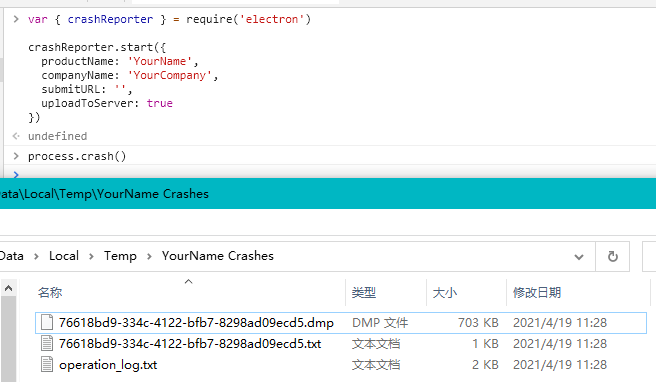
Only when crashReporter.start is executed in the Electron application will the crash-related directory and file information be generated. The following sample code is referenced from the official documentation.
Create a crash:
|
|
Find crash files.
By actually testing the above code, the crashed file was found in the temporary directory under the electron@5.x version with the .dmp suffix. As shown in the figure.

Electron crash file analysis
What is the application symbols file (Symbols)
The .dmp file obtained above is a minidump file, which is a file in the crash-to-storage technology format developed by Microsoft. The minidump file contains only the most necessary information to recover the call stack of all threads of the failed process and to see the values of local variables at the moment of failure.
To analyze the minidump file specifically, you need to use the symbols file of the Electron application.
The application symbols file is similar to the sourceMap file in the front-end, which allows debugging tools to map the crash information in the dump file to the original code and parse it. The format of symbols file varies from platform to platform, Windows platform applications are generally in .pdb format.
Google breakpad is a cross-platform crash dump and analysis framework and tools collection, it provides tools to support the conversion of crash files under all platforms to Symobol format as defined by Breakpad. The Symobol format is very simple, it is actually a plain text file, one record per line, with a space separating the fields in each record and the first field of each record indicating what type of record the line is.
If you are using the official Electron package, you can download the corresponding symbols file from github at
If it is a self-programmed application, it will output a symbolic file with the same name in the output directory of the executable. For example electron.exe -> electron.exe.pdb .
Debugging Electron with Windbg
For the minidump file, you can use Windbg to analyze it under windows. It is included in the windows SDK and you can install the windows 10 SDK directly.
A brief step-by-step procedure is roughly as follows (please consult the official documentation for a more detailed approach).
- Install the
windows 10 SDK - Search for
Windbgand open it - Press the
ctrl+Eshortcut and select theelectron.exeapplication file - At the bottom run
.reload /f /i electron.exeto load it. This will look for its corresponding symbol file, and will report an error if it is not found. You can place the corresponding symbol file in any directory in the error message, and then re-execute - Press
ctrl+sshortcut key to selectminidumpfile to load. - Just analyze it according to the loading situation
Related references:
- https://docs.microsoft.com/zh-cn/windows-hardware/drivers/debugger/debugger-download-tools
- https://developer.microsoft.com/zh-cn/windows/downloads/windows-10-sdk/
- https://docs.microsoft.com/zh-cn/windows-hardware/drivers/debugger/getting-started-with-windows-debugging
Analysis using the Sentry platform
Electron provides the official @sentry-cli and @sentry/electron toolkits available through Sentry. By installing and configuring them, you can integrate Sentry in your Electron application, which can help collect and analyze crash files.
Installation and Integration Sentry
Installing @sentry/electron.
Integrating Sentry in Electron Applications.
|
|
Configurator file download and Sentry upload
Follow the prompts and when you are done, a sentry-symbols.js file will be generated. Run it after each Electron update to download the corresponding symbols from the Electron Github Release address and upload them to your configured Sentry server.
For more specific information, please refer to the official documentation at
- https://docs.sentry.io/platforms/javascript/guides/electron/
- https://www.npmjs.com/package/@sentry/wizard
SourceMap of JavaScript files uploaded to Sentry
Integrating in webpack, uploading SourceMap to the Sentry server.
|
|
To configure the plugin in webpack.
|
|
Alternatively, you can use @sentry/cli to upload a SourceMap, for which the official documentation can be found at
Compile your own symbols file for Electron
If it is a self-coded application after modifying the Electron source code, the .pdb type file in the build output directory is the symbols symbol file, such as electron.exe.pdb, etc.
The Sentry platform supports symbol files in Breakpad format. In addition, the Sentry platform also supports Native-style pdb files, but does not support pdb files generated under the .NET platform.
We can use the dump_syms.exe utility to convert pdb format symbol files to Breakpad format. The dump_syms.exe file is in the Electron compilation directory at the following path third_party\breakpad\breakpad\src\tools\windows\binaries\dump_syms.exe. It can also be downloaded at the following address.
- https://github.com/electron/chromium-breakpad/blob/master/dump_syms.exe
- https://gitee.com/lzw/breakpad-minindump-tools/blob/master/tools/dump_syms.exe
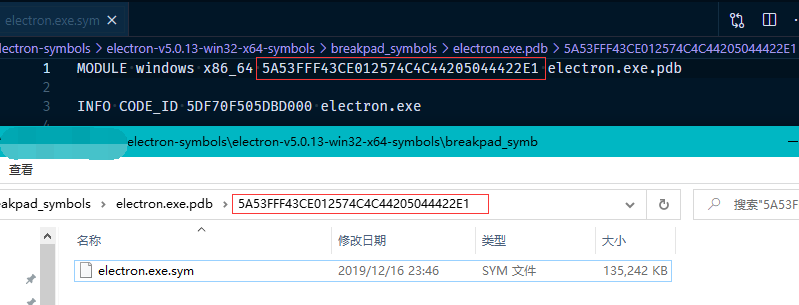
Example of electron.exe.sym file generated using dump_syms.exe tool.
|
|
Open the electron.exe.sym file and take a look. It is actually a SourceMap-like text file containing the original filenames and the mapping of variables, functions, methods and so on. The first line contains the system platform, Breakpadid and the corresponding pdb file name.
Sentry upload of self-coded Electron symbol files
The official symbol file downloaded from Electron contains the following information, which we can use to generate a package of the same format and provide to Sentry for upload. The paragraph after the electron.exe.pbd path is Breakpadid, which can be obtained from the first line of the symbol file.

In fact, the main logic in the sentry-symbols.js file is to download the corresponding symbols according to the currently installed version of Electron and upload them using @sentry/cli. We can also write a similar upload script. Example.
We refer to the electron-<version>-win32-x64-symbols.zip file downloaded from the official website as an example, and generate and compress a zip file of the same structure locally into the .electron-symbols/custom directory.
Generate Symbols symbols files from the Electron compile output directory, main example.
|
|
Compress the contents of the generated symbols directory into a zip file and place it in a custom directory, such as .electron-symbols/custom, then upload the symbols file to Sentry with the following main code example.
|
|
Execute the test, and if all goes well, the result will be approximately as follows.

Related references.
Related issues and solutions
The default release version pdb file output by Electron compilation is too large
The electron.exe.pdb file size is close to 1.5G to 2G in the directory of the Release version of the compiled output using the default parameters. This is because the default compiled output symbol file contains more information such as source code, you can adjust the output of the symbol file by setting the compile parameter symbol_level=1. This parameter can be added to the configuration file at
|
|
It can also be added to the command line of the generated GN project at
|
|
After setting symbol_level=1, the output electron.exe.pdb is only a little over 100 M in size.
Failed to generate sym file using dump_syms.exe
The error message is as follows.
CoCreateInstance CLSID_DiaSource {E6756135-1E65-4D17-8576-610761398C3C} failed (msdia*.dll unregistered?) Open failed
This is because the system has not registered the msdia*.dll file. From the Visual Studio installation directory, you can search for the msdia120.dll and msdia140 .dll files. Let’s register msdia140.dll and that’s it.
Start the cmd command prompt as system administrator (shortcut win+x, click “Command Prompt (Administrator)”), and then execute the following command to register msdia140.dll: msdia140.dll.
|
|

If executed with a non-system administrator cmd, you will get a registration failure message with the error code 0x80070005.
msdia140.dll is loaded, but the call to DllRegisterServer failed with error code 0x80070005