When analyzing problems with Electron applications, relevant system operation information is sometimes essential, so naturally there is a need for system base information collection and operation performance monitoring.
The native capabilities in Electron are based on Node.js, so most of the system data collection for Electron applications is based on the capabilities provided by Node.js. In Node.js applications, various system-related information can be obtained mainly through the process and os modules, which can be divided into static basic information and dynamically changing runtime information.
The following is a brief introduction to the information that may be used for statistical analysis of data.
Information provided by the process module in Node.js
process.pidThe PID of the current processprocess.ppidThe PID of the current process’s parent processprocess.platformReturns a string identifying the OS platform on which the Node.js process is runningprocess.cwd()Returns the current working directory of the application processprocess.archThe CPU architecture of the operating system on which the Node.js binary was compiled.process.argvReturns the array containing the command line arguments passed in when starting the Node.js process.process.versionsreturns the version information for Node.js and its dependenciesprocess.envThe environment variable for the application runtime environment.- process.cpuUsage([previousValue]) in object with attributes user and system Returns the user and system CPU time usage of the current process in microseconds
- process.memoryUsage() Returns an object describing the memory usage (in bytes) of the Node.js process
.heapTotaland.heapUsedrefer to the memory usage of V8..externalrefers to the memory usage of C++ objects bound to JavaScript objects managed by V8..rssresident set size, which is the amount of space occupied by the process in the main memory device (i.e., a subset of the total allocated memory), including all C++ and JavaScript objects and code..arrayBuffersis the memory allocated for ArrayBuffer and SharedArrayBuffer, including all Node.js Buffer. This is also included in the external value. This value may be 0 when Node.js is used as an embedded library, as ArrayBuffer allocations may not be tracked in this case.
- process.resourceUsage() Returns the resource usage of the current process
- Node.js@12.6+ / Electron@7.x+ only
- process.uptime() Returns the number of seconds the current
Node.jsprocess has been running
Information about the process module extension in Electron
process.resourcesPathThe path to the resource directory. You can count the location where the application was installed or started runningprocess.typeThe type of the current process. Can be:browser,renderer,worker- process.getCPUUsage() Returns the CPU usage of the current process.
- process.getHeapStatistics() Returns an object containing V8 heap statistics. All data values are in
KBunits - process.getSystemMemoryInfo() Returns an object that provides memory usage statistics for the entire system. The statistics are in
KB - process.getProcessMemoryInfo() Returns an object that provides memory usage statistics for the current process. The statistics are in
KB - process.getBlinkMemoryInfo()
- Returns an object with Blink memory information. Can be used to debug rendering/DOM related memory issues. All values are in KB
- Method added in
Electron@7+version
Statistical methods of information provided by electron
- electron.app.getAppMetrics()
- Returns ProcessMetric[]: an array of ProcessMetric objects containing memory and CPU usage statistics for all processes associated with the application.
- New
memoryfield added only toelectron@7+, contains memory usage statistics for all sub-processes
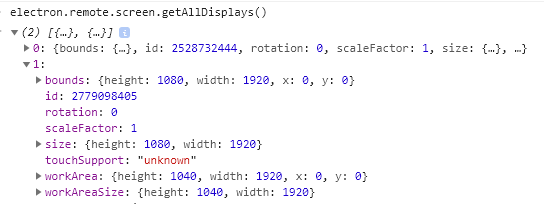
- electron.screen.getAllDisplays() returns an array of windows Display[], representing the currently available display windows .

Information provided by the os module in Node.js
os.platform()String identifier for the operating system platform, same asprocess.platformos.hostname()hostnameos.homedir()user home directoryos.type()operating system kernel nameos.endianness()Returns a string identifying the byte order of the CPU for which the Node.js binaries were compiled. Big Ending OrderBE, Little Ending OrderLE.- os.cpus() Returns an array of objects containing information about each logical CPU kernel.
os.uptime()Returns the system uptime in seconds. Same asprocess.uptime()os.totalmem()Total amount of memory. Same asprocess.getSystemMemoryInfo().totalos.freemem()The size of free memory. Same asprocess.getSystemMemoryInfo().freeos.loadavg()Average load for 1, 5 and 15 minutes. windows is always 0os.release()Returns the version number of the operating system as a stringos.tmpdir()Returns the default directory of the operating system’s temporary files as a string.- os.networkInterfaces() NIC information for the assigned URL
- os.userInfo([options]) Returns information about the currently active user
Data collection and analysis
Based on the capabilities provided by the above APIs, combined with practical experience in actual testing, we have come up with some experiences summarized below.
Data classification. We can classify the information collected by statistics into static basic information and dynamic information. Static basic information, i.e. data that does not change, can be counted and recorded only once during initialization. Static information can be used to analyze the state of specific application operating environment. Dynamic information is the data that may change every time it is acquired. The performance analysis of the application is mainly based on the regular monitoring and collection of dynamic information.
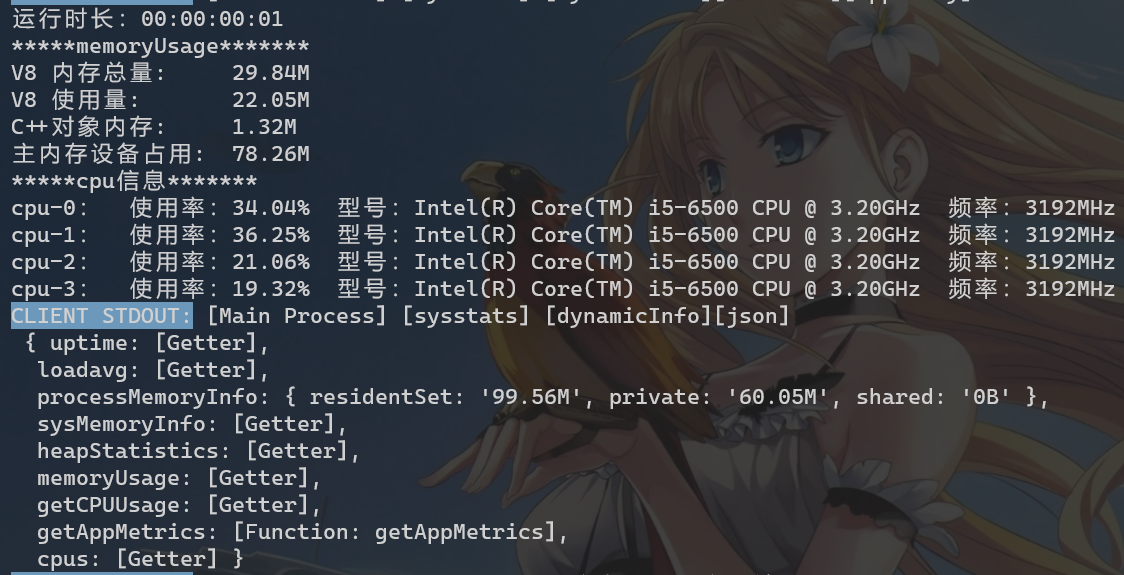
Data formatting. The raw data collected is not intuitive enough to be used for data statistics, but some pre-formatting is required for direct display. Mainly including time consumption, memory size, CPU utilization three types of data, design the corresponding formatting auxiliary functions, after obtaining data for pre-processing can be. See the code examples below for details.
The APIs provide a lot of data. In the data collection and analysis based on application performance, the data that are dynamically monitored are mainly the CPU usage and memory usage of each process. Most of the data can be collected in the main process.
For the dynamically changing data, it needs to be collected at intervals according to certain strategies, and then it can be exported to the targeted analysis platform to draw the dynamically changing curves for observation and analysis.
Node.js system information statistics implementation code reference
The above information collection and analysis, a simple implementation of SysInfoStats statistics class for the regular collection of system information. The specific code reference is as follows.
|
|
