The dart language used by Flutter has a garbage collection mechanism, and with garbage collection, memory leaks are inevitable. There is a memory leak detection tool LeakCanary on the Android platform that can easily detect if the current page is leaking in a debug environment. This article will take you through the implementation of a flutter-ready LeakCanary and tell you how I used it to detect two leaks on the 1.9.1 framework.
1, the weak reference in Dart
In languages with garbage collection, weak references are a good way to detect if an object is leaking. We just weakly reference the observed object and wait for the next Full GC, if the object is null after the gc, it is recycled, if it is not null, it is probably leaking.
Dart language also has a weak reference, it is called ``Expando
You may wonder where the above code is weakly referenced? It’s actually in the assignment statement expando[key]=value. `Expando will hold the key in a weak reference, and this is where the weak reference is.
The problem is that the Expando weak reference holds a key, but it does not provide an api like getKey(), so we have no way to know if the `key object has been recycled.
To solve this problem, let’s look at the specific implementation of Expando in expando_path.dart:
|
|
Note: This patch code is not available for the web platform
We can find that the key object is put into the _data array, wrapped with a _WeakProperty, then this _WeakProperty is the key class, look at its implementation, on behalf of … code in weak_property.dart:
This class has the key that we want to use to determine if the object is still there!
How to get such private properties and variables? The dart in flutter does not support reflection (reflection is turned off to optimize packing size), is there any other way to get such private properties?
The answer is definitely “yes”. To solve the above problem, I introduce a service that comes with dart from my side, Dart VM Service.
3, Dart vm_service
The Dart VM Service (later referred to as vm_service) is a set of web services provided internally by the dart VM, and the data transfer protocol is JSON-RPC 2.0. However, we do not need to implement the data request parsing ourselves, as an official dart sdk has been written for us to use vm_service.
The role of ObjRef, Obj and id
Let’s introduce the core content in vm_service: ObjRef, Obj, id.
The data returned by vm_service is divided into two main categories, ObjRef (reference type) and Obj (object instance type). Where Obj contains the complete data of ObjRef and adds additional information on top of it (ObjRef contains only some basic information, such as: id, name…). .).
Basically all the data returned by api is ObjRef, when the information inside ObjRef doesn’t satisfy you, then call getObject(,,,,) to get Obj.
About id: Obj and ObjRef both contain id, this id is an identifier of the object instance in vm_service, almost all api of vm_service need to operate by id, for example: getInstance( isolateId, classId, ...), getIsolate(isolateId), getObject(isolateId, objectId, ...).
How to use the vm_service service
vm_service opens a websocket service locally when it starts, and the service uri is available in the corresponding platform at:
AndroidinFlutterJNI.getObservatoryUri()iOSinFlutterEngine.observatoryUrl
Once we have the uri, we can use the vm_service service. There is an official sdk vm_service written for us, and we can use the internal vmServiceConnectUri to get an available VmService object.
The parameter of
vmServiceConnectUrineeds to be a uri of the ws protocol, which is obtained by default with the http protocol and needs to be converted with theconvertToWebSocketUrlmethod
3, Leak detection implementation
With vm_service, we can use it to make up for the lack of Expando. According to the previous analysis, we want to get _data, a private field of Expando. Here we can use the getObject(isolateId, objectId) api, whose return value is Instance, and the internal fields field holds all the properties of the current object. This allows us to iterate through the properties to get _data to achieve the effect of reflection.
Now the question is what is isoateId and objectId in the api parameter, which is the identifier of the object in vm_serive according to the id related content I described earlier. That is, we can only get these two parameters through vm_service.
Get IsolateId
Isolates are a very important concept in dart, basically an isolate is equivalent to a thread, but different from our usual threads: memory is not shared between different isolates.
Because of the above feature, we also need to bring isolateId when looking for objects. The getVM() api of vm_service can get the VM object data, and then the isolates field can get all the isolates of the current VM.
So how do we filter the isolate we want? For simplicity, only the main isolate is filtered, and you can check the source code of dev_tools: service_manager.dart#_initSelectedIsolate function.
Obtaining the ObjectId
The objectId we want to get is the id of expando in vm_service, and here we can extend the question.
How to get the id of the specified object in vm_service?
There is no api for instance object and id conversion in vm_service, there is an api getInstance(isolateId, classId, limit) which can get all subclass instances of a classId, not to mention how to get the desired classId, the performance and limit of this api are worrying.
Is there no good way? Actually, we can use the top-level functions of Library (written directly in the current file, not in the class, such as the `main function) to achieve this function.
In general, a dart file is a
Library, but there are exceptions, such aspart ofandexport.
vm_service has an invoke(isolateId, targetId, selector, argumentIds) api that can be used to execute a regular function (getter, setter, constructor, private function are unconventional functions), where if targetId is the id of Library, then invoke executes the top-level function of Library.
With the path to the `invoke Library top-level function, you can use it to implement object-to-id, the code is as follows.
|
|
Object Leakage Determination
Now that we can get the id of the expando instance in vm_service, the next step is simple
First get Instance through vm_service, traverse the fields property inside, find the _data field (note that _data is of type ObjRef), and convert the _data field to type Instance in the same way (_data is an array, Obj has the child information of the array).
Iterate through the _data field, if it is all null, it means that the key object we are observing has been released. If item is not null, turn item into Instance again and take its propertyKey (because item is of type _WeakProperty, Instance has this field specifically for _WeakProperty).
Forced GC
As mentioned at the beginning of the article, if you want to determine whether an object is leaking, you need to determine whether the weak reference is still there after Full GC. Is there any way to trigger gc manually?
The answer is yes, vm_service doesn’t have an api to force gc, but there is a GC button in the top right corner of the dev_tools memory icon, so we can just follow it! dev_tools calls the vm_service getAllocationProfile( isolateId, gc: true) api of vm_service to achieve manual gc.
As for whether this api triggers a FULL GC or not, it is not specified, all my tests trigger a FULL GC. So far, we have been able to implement leak monitoring, and we can get the id of the leak target in vm_serive, so we will start to get the analysis of the leak path.
4,Get the leak path
For getting the leak path, vm_service provides an api called getRetainingPath(isolateId, objectId, limit). This api can be used directly to get the reference chain information of the leaked object to the gc root. But this alone won’t work, because it has the following pitfalls.
Expando holds questions
If the leaked object is held by expando while executing getRetainingPath, the following two problems arise
-
Because the api returns only one reference chain, the returned reference chain goes through expando, making it impossible to get the real leaked node information
-
Native crash on arm devices, specifically on utf8 character decoding
-
Native crash on arm devices, specifically on utf8 character decoding
This problem can be solved easily by releasing the expando after the leak detection in the front.
id expiration issue
The Instance type id is different from the Class, Library, Isolate ids, which will expire. vm_service has a cache size of 8192 by default for such temporary ids, which is a circular queue.
Because of this problem, when we detect a leak, we can’t just save the id of the leaked object, we need to save the original object, and we can’t hold the object by strong reference. So here we still need to use expando to save our detected leak object, and wait until we need to analyze the leak path, and then dedicate the object to id.
5, Memory leak on 1.9.1 framework
After completing leak detection and path fetching, I got a rudimentary leakcanary tool. When I tested this tool under framework version 1.9.1, I found that it leaked a page when I observed a page!
Looking at the objects dumped by dev_tools, there is indeed a leak!
That is, there is a leak in the 1.9.1 framework, and the leak is leaking the whole page.
Next, we started to investigate the cause of the leak, and here we ran into a problem: the leak path was too long. The link length returned by getRetainingPath is 300+, and I couldn’t find the root cause of the problem even after an afternoon of troubleshooting.
Conclusion: It is difficult to analyze the source of the problem directly based on the data returned by vm_service, so we need to process the information of the leak path twice.
How to shorten the citation chain
First look at why the leak path is so long, by observing the returned link found that the majority of nodes are flutter UI component nodes (for example: widget, element, state, renderObject).
That is, the reference chain goes through the flutter component tree, and those who have played with flutter should know that the flutter component tree is very deep. Since the reference chain is long because it contains the component tree, and the component tree basically appears in blocks, we can significantly shorten the leak path by simply sorting and aggregating the nodes in the reference chain according to their types.
Classification
The nodes are divided into the following types based on flutter’s component types.
- element: corresponds to the Element node
- widget: corresponds to a widget node
- renderObject: corresponds to the RenderObject node
- state: corresponds to the
State<T extends StatefulWdget>node - collection: corresponding collection type node, for example: List, Map, Set
- other: corresponds to other nodes
Polymerization
Once the nodes are well classified, you can aggregate the nodes of the same type. Here is my aggregation method
If two collections of the same type are connected by a collection node, continue to merge the two collections into one, recursively.
With classification-aggregation, a link length of 300+ can be reduced to 100+.
Continue to investigate the 1.9.1 framework leaks, although the path is shortened, you can find the problem appears in the FocusManager node! But the specific problem is still difficult to locate, mainly the following two points.
-
Lack of code location for reference chain nodes: Because the RetainingObject data only has three fields, parentField, parentIndex and parentKey, to represent the information of the current object referencing the next object, it is inefficient to find the code location through this information.
-
No information about the current flutter component node: for example, the text information of the Text, the widget where the element is located, the lifecycle state of the state, which page the current component belongs to. etc.
Between the above two pain points, the information of the leaking nodes also needs to be extended.
-
Code location: the reference code location of the node actually only needs to resolve the parentField, through the vm_serive parsing class, take the internal field, find the corresponding script and other information. This method can get the source code
-
Component node information: flutter’s UI components are all inherited from Diagnosticable, which means that as long as the nodes of Diagnosticable type can get very detailed information (during dev_tools debugging, the component tree information is obtained through the
Diagnosticable. debugFillPropertiesmethod). In addition to this, you need to extend the route information of the current component, which is very important to determine the page where the component is located
Identification 1.9.1 framework Leakage root cause
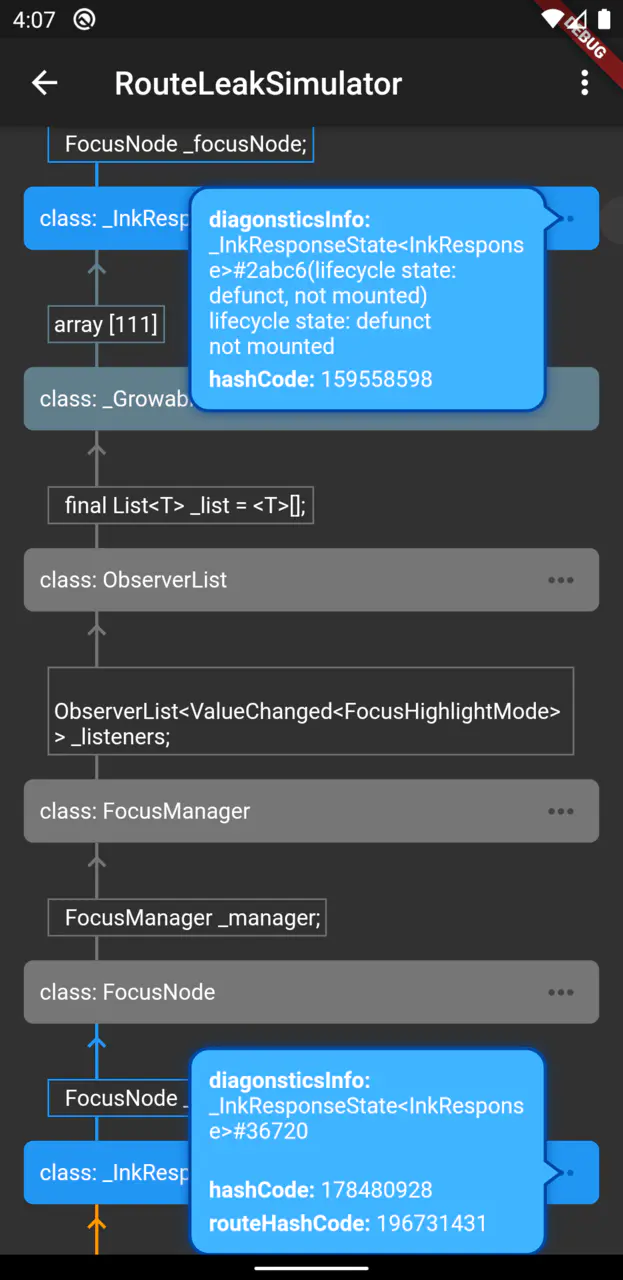
After all the above optimizations, I got the following tool, which found problems in two _InkResponseState nodes.

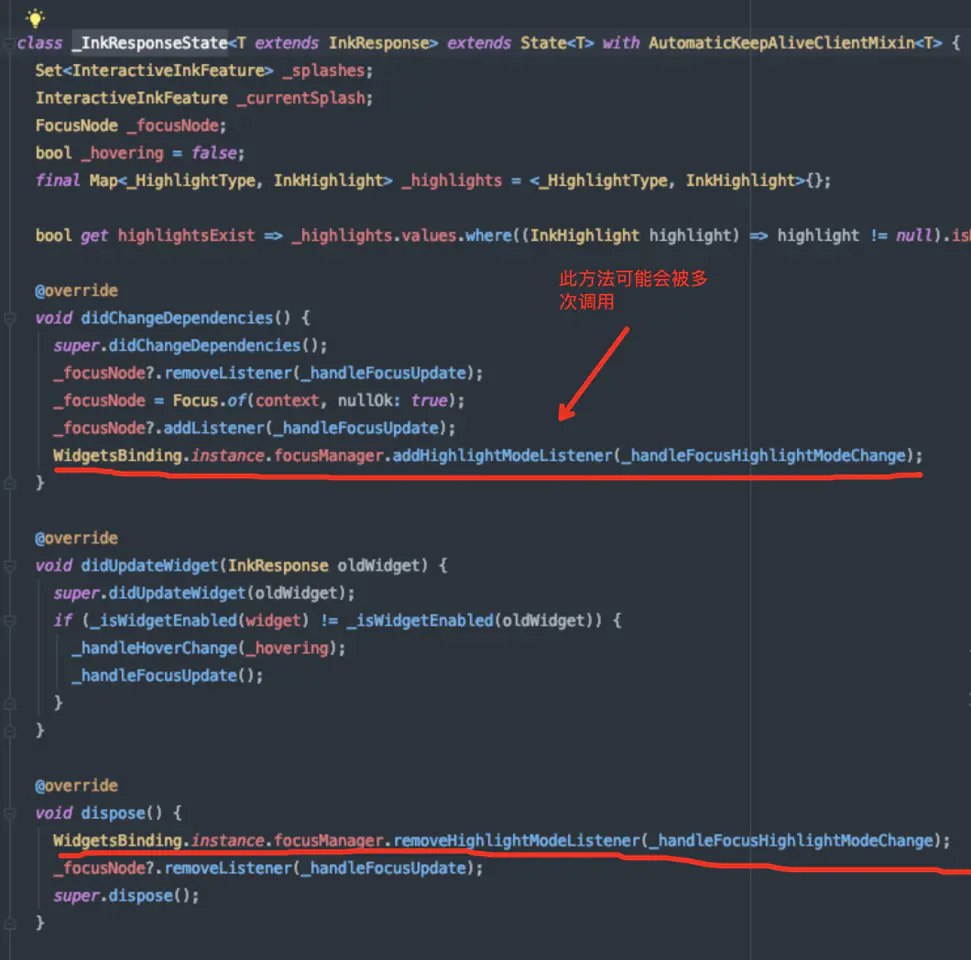
There are two _InkResponseState nodes in the leak path that have different route information, indicating that they are in two different pages. The description of the top _InkResponseState shows that the lifecycle is not mounted, indicating that the component has been destroyed, but is still referenced by the FocusManager! Here’s the problem, take a look at this part of the code

The code clearly shows that addListener has a wrong understanding of the lifecycle of StatefulWidget. didChangeDependencies is called multiple times, while dispose is called only once, so here the listener is not removed cleanly.
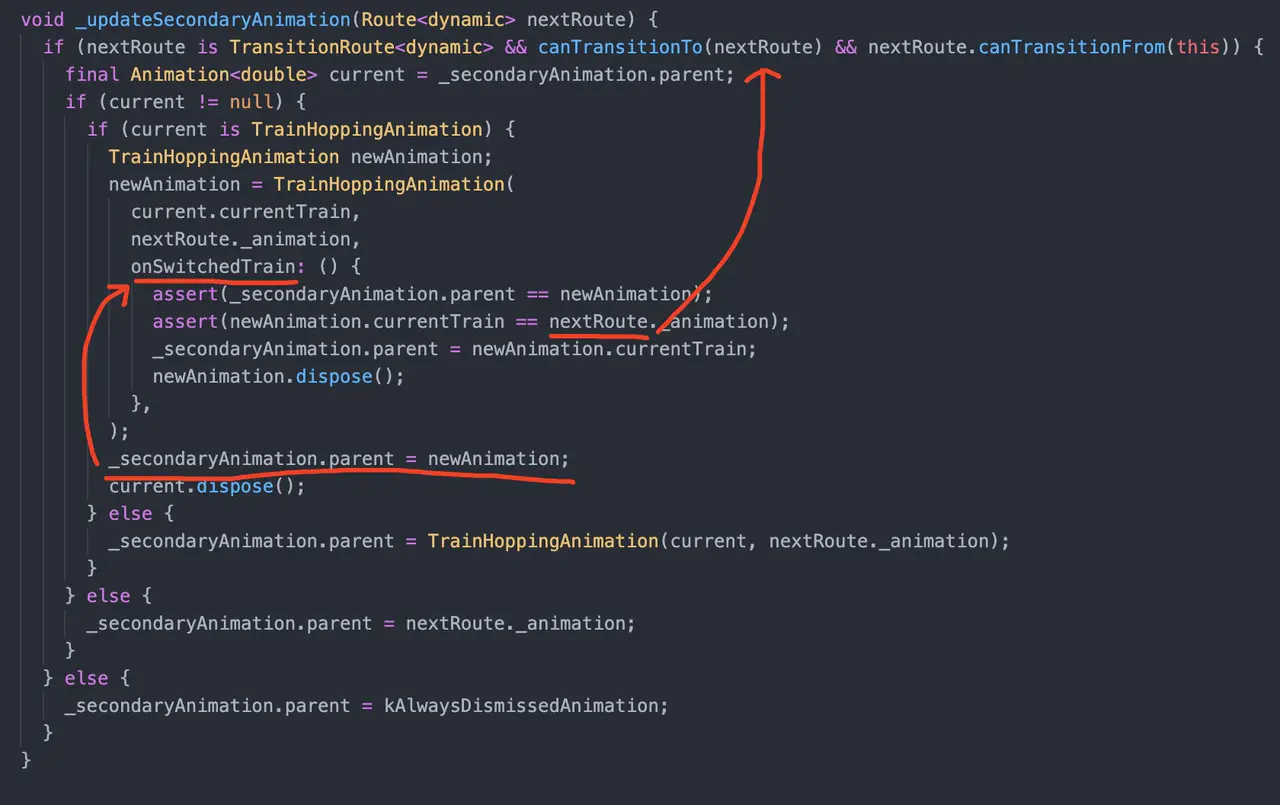
After fixing the above leak, I found one more leak. After troubleshooting, we found that the source of the leak is in TransitionRoute.

When a new page is opened, the Route of that page (that is, the nextRoute in the code) will be held by the animation of the previous page, and if the page jumps are all TransitionRoute, then all the routes will leak!
The good news is that the above leaks have been fixed since version 1.12
After fixing the above two leaks, I tested again and Route and Widget can be recycled, so the 1.9.1 framework is finished.
Referenece https://juejin.cn/post/6844904191828164615